Generating report of RaveReport type based on Microsoft Access table in Borland C ++ Builder
Contents
- Task
- Instructions
- 1. Run Borland C++ Builder. Save the project. Create Windows-application
- 2. Connect to Microsoft Access database
- 3. The components from the Rave tab
- 4. Creating the file of report
- 5. Setting up of component RvReport1
- 6. Setting up the connection between Rave Report and database
- 7. Setting the component ADOQuery1
- 8. Generating report with the help of wizard
- 9. Run the report
- 10. Calling the report from the main program
- 11. Summarize
Search other websites:
Task
We have a database, that was created by Microsoft Access. Database is placed in the “udb2.mdb” file. Database contains three tables with the following structure:
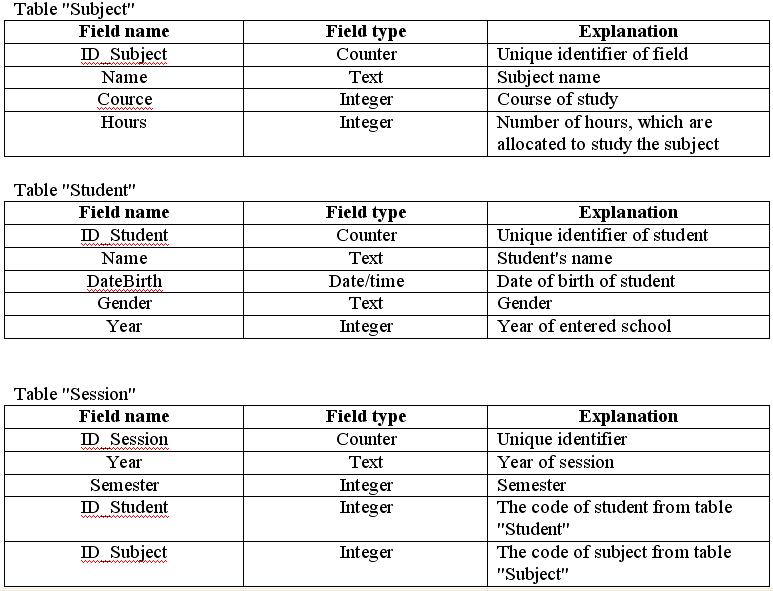
The tables are linked by the following scheme (fig. 1):

Fig. 1. The interconnection scheme between tables
The ID_Student field of table “Student” is the lookup field for the ID_Student field of table “Session“. The ID_Subject field of table “Subject” is the lookup field for the ID_Subject field of table “Session“.
Into tables of database already inputted about 5-6 strings.
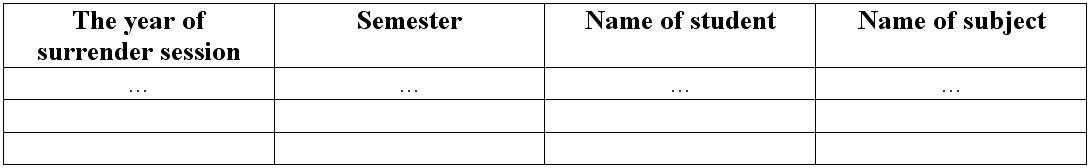
The task is to build the report using tools of C++ Builder, which is based on data from different tables of database. For generating the report we will use “Rave Report” component, that is supplied with Borland C++ Builder. The structure of report is following:
⇑
Instructions
1. Run Borland C++ Builder. Save the project. Create Windows-application
A detailed example of creating Windows-application is described here. Save the application in any folder.
⇑
2. Connect to Microsoft Access database
A detailed example how to connect Microsoft Access database is described here.
To connect to database file “udb2.mdb” we place on the form such components:
- from tab “dbGo” the component of TADOConnection type, which will be responsible of object variable named ADOConnection1;
- from tab “dbGo” the component of TADOQuery type (object ADOQuery1);
- from tab “Data Access” the component of TDataSource type (object DataSource1).
Main form of application has view (fig. 2).

Fig. 2. Main form of application
Set up the properties of the component for access to database.
Primarily, we configure the property ConnectionString of ADOConnection1 component. Select the ADOConnection1 component (fig. 3).

Fig. 3. Property “ConnectionString” of “ADOConnection1” component
In Object Inspector into the field of ConnectionString property click on the button “…“. The window of wizard of connecting to database will be opened. Following step by step instructions of the wizard we configure the connection to the database Microsoft Access.
Select such fields in the wizard:
- into the field “Provider OLE DB” we select the “Microsoft Jet 4.0 OLE DB Provider“;
- into the field “Connection” we select the name of database file “udb2.mdb“.
After configuring the ConnectionString property in the component ADOConnection1, we connect this component with ADOQuery1 and DataSource1.
For this:
- the property Connection of component ADOQuery1 set to a value ADOConnection1;
- the property DataSet of component DataSource1 set to value ADOQuery1;
- LoginPrompt property (component ADOConnection1) set to the value “false” (in order to avoid the constant query Login and password when you open the database).
After actions, we have made the connection to the database “udb2.mdb“.
With the help of ADOQuery1 component, now we can form a queries to the database and create own tables for generating of the report.
⇑
3. The components from the Rave tab
At the Rave tab of components palette “Tool Palette” are shown the components for generating the reports. In our case we place on the form such components from the Rave tab:
- component of TRvProject type, which will be responsible to object (variable) RvProject1;
- component of TRvSystem type (object-variable RvSystem1);
- component of TRvDataSetConnection (object-variable RvDataSetConnection1).

Fig. 4. Components RvProject1, RvSystem1, RvDataSetConnection1
Let us explain briefly the purpose of each component.
TRvProject component connects with the file, in which the report is formed. The file has “*.rav” extension. In our case name of file has the same name as proposed by default, ie “Report1.rav“. The file has all the necessary tools to create the report: text fields, graphic objects, data fields for getting the information from database and others.
TRvSystem component implements the customization capabilities of settings page, setting up of fields at print the report and more.
The TRvDataSetConnection component is used for connecting between the report, that is in file “Report1.rav“, and database.
In general, the scheme interconnection between components of application, database and file of report has the view (fig. 5).

Fig. 5. The scheme of interconnection between components of application
⇑
4. Creating the file of report
The work to creating a file of report is carried out with the help of a special editor, which is called from the context menu after clicking the right mouse button on the component RvProject1.
In the context menu we select “Rave Visual Designer…” (fig. 6).

Fig. 6. Selecting “Rave Visual Designer…” editor
In general case, the window of editor “Rave Report” has the view (fig. 7).

Fig. 7. The window of editor “Rave Report“
As we see, the sheet of report is empty yet and does not contain any information.
On the next step, we have save the report by selecting the “Save” command from the “File” menu. As a result, the window “Save Project1.rav As” will be opened. In this window we select the folder in which will be saved file of report (fig. 8).

Fig. 8. The window of saving the report
It is recommended to save a file of report in the same directory with the files of developed application. We will do so, leaving filename “Project1.rav“.
⇑
5. Setting up of component RvReport1
Let’s configure the component RvReport1.
At first, we configure the file path “Report1.rav“. For this, in the field of property “ProjectFile” we do click on the button “…” and in the window of file selection we select the file “Project1.rav“, after selecting the folder in which this file was saved (see item 5).
On the next step, we set the property “Engine” to value RvSystem1 (from dropdown list). It means, that the page settings and the view mode will be set for file of report “Report1.rav” (fig. 9).

Fig. 9. Configuring the properties of RvProject1 component
⇑
6. Setting up the connection between Rave Report and database
For setting up the connection between Rave Report and database use the RvDataSetConnection1 component.
The property DataSet of this component set to value ADOQuery1 (fig. 10).

Fig. 10. Setting up DataSet property of RvDataSetConnection1 component
⇑
7. Setting the component ADOQuery1
7.1. Forming a SQL-query
Since in the problem you need to create a report based on data from three tables, it is best suited for this request to the database the SQL language. This is the reason of using ADOQuery1 component in the program. Property “SQL” of component ADOQuery1 allows you to create such requests.
In our case, the request at SQL-language will have view:
SELECT [Session].Year, [Session].Semester,
       Student.Name, Subject.Name
FROM [Session], Student, Subject
WHERE ([Session].ID_Student=Student.ID_Student) AND             ([Session].ID_Subject=Subject.ID_Subject)
As seen from text of SQL-query, the data are got from three tables and contain four fields under the terms of the problem.
We type the above text into property “SQL” of component ADOQuery1. The editor for text is called by clicking the mouse on the button ‘…’ in the property “SQL” (fig. 11).

Fig. 11. Editor for SQL-query of ADOQuery1 component
⇑
7.2. Activation ADOQuery1
After that we need set the property “Active” to value “true“.
⇑
7.3. Adding the displaying fields to ADOQuery1
Do the click of right button of mouse at component ADOQuery1. In the context menu select “Fields Editor…“. As a result the fields editor will be opened. Next in the editor window with the help of right button of mouse using command “Add All Fields” add all fields:
- Year;
- Semester;
- Student.Name;
- Subject.Name.
⇑
8. Generating report with the help of wizard
Again, we call the editor of your report “Rave Reports” by calling “Rave Visual Designer …” from the context menu of component RvProject1 (see item 5). Automatically into editor of reports will be downloaded the file, which is connected with RvProject1 component (in our case file named “Project1.rav“).
⇑
8.1. Adding data to report in report file “Report1.rav”
In order for the database file was available in the report “Report1.rav” we need to create a new data object. This implemented by command “New Dataobject” from the menu File (fig. 12).

Fig. 12. Creating a new data object
As result the window “Data Connections” will be opened. In this window is proposed several cases of choice of type of data object. In our case we select “Direct Data View” and we click on the “Next >” button (fig. 13).

Fig. 13. Selecting “Direct Data View” connection
In the next window a list of active connections with data opens. In our case only the one connection is active, that corresponds to RvDataSetConnection1 component from main program. We confirm our choice by clicking on “Finish” button (fig. 14).

Fig. 14. Selecting Active Data Connections
On the right side of editor we can see, how was added “DataView1” object into “DataViewDictionary” list. If we
If we will uncover this object (key “+”), we can see the newly created fields of table, which are based on SQL-query of component ADOQuery1 in main program.

Fig. 15. The fields of DataView1 object
For field “Year of putting session” corresponds the DataView1SessionYear object, for field “Semester” of table corresponds DataView1SessionSemester object etc.
After that, we already have the link of report with database.
⇑
8.2. Calling of wizard of report building
The view of report and view of data in it we can form by using tools of “Rave Reports” editor, that are on the toolbox. But for work with data, which are received from database, is recommended to use the built-in wizard of report generating.
This will greatly facilitate the process of linking of data with elements of the report. After calling of wizard, we can edit the view of report as we like.
The data from database for report are taken from RvDataSetConnection1 component, which is formed on the query that is described in ADOQuery1 component of program.
So, the wizard is called by sequence of clicking such commands (fig. 16):
“Tools –> Report Wizard –> Simple Table”

Fig. 16. Calling the wizard of report building
As result the window “Simple Table” will be open. In the window is proposed to select the element of data view. In our case we have only one object DataView1. Click on the “Next >” button (fig. 17).

Fig. 17. The window of selecting of element “DataView1” of data view
In the next window (fig. 18) is proposed to select the fields of DataView1 object, that will be used in the report. We select all fields, since they all have to be displayed in accordance with the condition of the problem. Click on the “Next >” button.

Fig. 18. Selecting fields from DataView1 to display them in a report
In the next window (fig. 19) is proposed to regularize the fields. We leave all as is. Click on the “Next >” button.

Fig. 19. Selecting the display order of fields
The next window of wizard (fig. 20) proposes to set the display options:
- report title (field “Report Title”);
- possibility of printing of report title (Print Report Title);
- limiting fields, which are related to page size, within which a report will be generated.
We change only title, for example “My Rave Report”. Click on the “Next >” button.
")
Fig. 20. Setting up the options of report display (title, printing fields)
In the last window of wizard (fig. 21) is proposed to change the font of title, message font and main font. It is done by clicking on the one of the buttons with name “Change Font”. Click on the button “Generate”.

Fig. 21. Changing the font of title, message font and font of main text
After this the report will be generated (fig. 22).

Fig. 22. The window of generated report
⇑
9. Run the report
We run the report by “F9” button or by command “Execute Report” from the menu “File”. As a result, the window (fig. 23) will be shown, in which we confirm by clicking on “OK” button (view mode – Preview).

Fig. 23. The window of executing of report
On the next step the report will be displayed (fig. 24).

Fig. 24. Display of the report on screen
As see on figure, the report has not correct display, although the data is displayed well.
With the help of tools of “Rave Report” editor we correct this data. In order to change properties any element (object) of report we need select it before. Then in the object editor (like to “Object Inspector”) we must change the corresponding property.
For example, to change the text message, we must use the property “Text” (fig. 25).

Fig. 25. Changing the text with the help of “Text” property
At the top side of editor is placed tools palette. For example, to set the centering the object in it’s own limits we need use the tab “Fonts” from tools palette (fig. 26).

Fig. 26. Tab “Fonts”
It is important here not to confuse the bands in the report. Is shown below the different types of bands (fig. 27).

Fig. 27. Forming bands in the report
At the figure with number 1 shown the band, that corresponds to title of report. At the number 2 is shown the band of fields titles of table. The number 3 shows the band, in which data are displayed, that were formed on SQL-based query in component ADOQuery1 of application.
We change the report into a more intuitive view. Run the report again (press F9).

Fig. 28. Final Report
Save the report file as “Report1.rav”. Exit the Rave Report.
⇑
10. Calling the report from the main program
After report creating we will realize a programming of an event of preview the report.
For getting this we place on the form the component of TButton type (corresponds the variable-object Button1). The “Caption” property of the button we set to “Show report” value (fig. 29).
")
Fig. 29. Main form of application (the final view)
We program the event of clicking at the Button1. The program code of this event has next view:
TForm1::Button1Click(TObject *Sender)
{
  RvProject1->Execute();
}
So, to call the report enough call the method Execute() of RvProject1 component, that is linked with the report (the “Project1.rav” file).
The task is solved.
⇑
11. Summarize
To form the report, in which data are getting from several tables, we need to form an SQL-query to database. This SQL-query will form a table, that is needed to form the report. Then, this table must be use for set up of report work and with the help of wizard in report editor we need to form the report.
As a whole, the application uses following components:
- from the “dbGo” tab, the component of TADOConnection type, which is needed for linking with database;
- from the “dbGo” tab, the component of TADOQuery type, which includes a SQL-query;
- component of TRvProject type, which links our application with the report file (“Report1.rav”);
- component of TRvSystem, which realizes page setup for report output to print;
- component of TRvDataSetConnection type, that realizes the connection between database and report;
- component of TButton type.
For building the report file “Report1.rav” is used the editor “Rave Report 7”.