Developing the application of program of drawing the graph of the two variables function (3D graph)
In this theme is described the application developing of drawing the graph of two variables function
z = f(x, y)
As an example, the following function is realized:
z = sin(x) + cos(y)
Using the given example, you can create own programs to drawing the graphs of other functions.
Contents
- Task
- The mathematical formulation of the problem
- Performing
- 1. Creating the project as Windows Forms Application
- 2. Develop the form Form1
- 3. Creating the form Form2
- 4. Entering the internal variables in the Form2 form
- 5. Programming the internal methods of the form Form2
- 6. Programming the event Paint of form Form2
- 7. Programming of events of clicking on the buttons button1, button2, button3, button4
- 8. Programming the event handlers MouseDown, MouseMove and MouseUp
- 9. Listing of module “Form2.cs“
- 10. The event programming of clicking on the button button1 of form Form1
- 11. Run the application
Search other websites:
Task
Is given the formula of function of two variables z = sin(x) + cos(y). Develop the application, which draws the graph of this function in a separate form. In additional, you need realize the rotation of graph. Also program must be display the axes OX, OY, OZ.
The mathematical formulation of the problem
Building a function of two variables is a mathematical solved problem, which uses known calculation formulas.
The graph of the two variables z (x, y) is constructed in a parallelepiped with dimensions (xx1, xx2), (yy1, yy2), (zz1, zz2).
To use the system of rotation in 3-dimensional space, there is the concept of the point (x0, y0, z0), relative to which the rotation of the coordinate system is realized.
Also, there is the concept of angles:
 (alpha) – rotation of system about the axis OZ;
 (beta) – rotation of system about the axis OX.
The shift in the point (x0, y0, z0) based on the rotation angles ![]() and
and ![]() is described by the known relations
is described by the known relations

After matrix multiplication we obtain the formula for the calculation:
 According to this formula will be the transformation of the coordinate system and scaling (Figure 1).
 Figure 1. The shift and rotation of the coordinate system
You must decide in what the monitor plane will be located the axes OX, OY, OZ. We accept that in the plane of the monitor are the axis OX and OY. A OZ axis is perpendicular to the screen.
The coordinates of calculation point (x, y) are pressed to the point (0, 0) by the formulas:
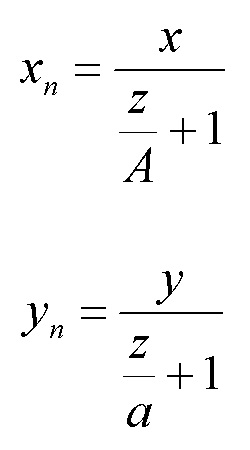 where A, a – the coefficients of perspective that are chosen experimentally depending on the function.
⇑
Instructions
1. Create project as Windows Forms Application
Create the project as Windows Forms Application. The detailed example how to create a Windows Forms Application is realized here.
Save the project. Automatically, the main form of application is created. The name of source module of main form is “Form1.cs”.
⇑
2. Develop the form Form1
Create a form as shown in Figure 2.
 Figure 2. The view of main form of program
Set the following properties of components and form:
- in the form Form1 property Text = “Graph of function of two variables”;
- in the form Form1 property MaximizeBox = False;
- in the form Form1 property StartPosition = “CenterScreen”;
- in the component button1 property Text = “Show the graph of function …”;
⇑
3. Creating the form Form2
Create a new form. The detailed example of a new form creating is described here.
The names of files of form are “Form2.cs” and “Form2.Designer.cs”.
Place on the form four components of Button type. Automatically is created a four objects with names button1, button2, button3, button4.
Set the properties of components and form as follows:
- in the form Form2 property StartPosition = “CenterScreen”;
- in the form Form2 property Text = “The graph of function z = f(x,y)”;
- in the component button1 property Text = “^”;
- in the component button2 property Text = “v”;
- in the component button3 property Text = “<”;
- in the component button4 property text = “>”.
Approximate view of the form “Form2” is shown in Figure 3.
 Figure 3. Form Form2 of application
⇑
4. Enter the internal variables in the Form2 form
All internal variables, which are used to organize of graph viewing, are placed in the class of form “Form2”. Therefore, first, you need to activate module “Form2.cs”.
In the module of form “Form2” are inputted the following variables with the class of visibility “private”:
- xx1, xx2, yy1, yy2 – correspond to coordinates of points, which are displayed on the screen;
- arrays xx and yy are intended to display a plane of the 4 pixels. The domain of the function z = f(x, y) is divided into rectangles, in any of which the function is extrapolated by the edges of quadrangle.
In the public section are inputted:
- variables X_min, Y_min, X_max, Y_max of real type, which are the real coordinates of parallelepiped, in which the graph of function is shown. These variables are filled from the main form Form1 experimentally;
- variables “alfa”, “beta” of real type, which display the angles for the graph of the function. They are filled from the main form Form1;
- variables x0, y0, z0 of real type. They display the values from main formula of calculation (see the mathematical formulation of the problem);
- variable A of the real type. It represents the coefficient of perspective and it is chosen experimentally;
- variable f_show of a logical type is used to indicate that the need to redraw the graph, in the case of changes in the position angles alfa and beta.
After inputting the variables into the text of program, the code snippet of Form2 is following:
...
public partial class Form2 : Form
{
    private int xx1, xx2, yy1, yy2;
    private int[] xx = new int[4];
    private int[] yy = new int[4];

    public int left;
    public int top;
    public int width;
    public int height;
    public double X_min, Y_min, X_max, Y_max;
    public double alfa, beta;
    public double x0, y0, z0;
    public double A;
    public bool f_show;

    public Form2()
    {
        InitializeComponent();
    }
}

...
Variables, which have the access identifier “public”, are filled from the form Form1.
⇑
5. Programming the internal methods of the form Form2
Into the class Form2 are inputted three additional methods:
- function Zoom_XY() of converting of coordinates system and scaling;
- function func() for which the graph is showed;
- function Show_Graphic() of drawing the graph.
Listing of method Zoom_XY() is following:
private void Zoom_XY(double x, double y, double z, out int xx, out int yy)
{
  double xn, yn, zn;
  double tx, ty, tz;

  tx = (x - x0) * Math.Cos(alfa) - (y - y0) * Math.Sin(alfa);
  ty = ((x - x0) * Math.Sin(alfa) + (y - y0) * Math.Cos(alfa)) * Math.Cos(beta) -
        (z - z0) * Math.Sin(beta);
  tz = ((x - x0) * Math.Sin(alfa) + (y - y0) * Math.Cos(alfa)) * Math.Sin(beta) +
        (z - z0) * Math.Cos(beta);

  xn = tx / (tz / A + 1);
  yn = ty / (ty / A + 1);

  xx = (int)(width * (xn - X_min) / (X_max - X_min));
  yy = (int)(height * (yn - Y_max) / (Y_min - Y_max));
}
Listing of method func() is following.
private double func(double x, double y)
{
  double res;
  res = Math.Sin(x) + Math.Cos(y);
  return res;
}
In this method, instead a string
res = Math.Sin(x) + Math.Cos(y);
you can insert your own function.
Immediate output of the graph of function is implemented in Show_Graphic() method.
Listing of method Show_Graphic() is following.
private void Show_Graphic(PaintEventArgs e)
{
  const double h = 0.1;
  const double h0 = 0;
  int i, j;

  Rectangle r1 = new Rectangle(left, top, left+width, top+height);
  Pen p = new Pen(Color.Black);
  e.Graphics.DrawRectangle(p, r1);

  // Create a font
  Font font = new Font("Courier New", 12, FontStyle.Bold);
  SolidBrush b = new SolidBrush(Color.Blue);

  // drawing the axes
  // axis X
  Zoom_XY(0, 0, 0, out xx1, out yy1);
  Zoom_XY(1.2, 0, 0, out xx2, out yy2);
  e.Graphics.DrawLine(p, xx1, yy1, xx2, yy2);
  e.Graphics.DrawString("X", font, b, xx2 + 3, yy2);

  // axis Y
  Zoom_XY(0, 0, 0, out xx1, out yy1);
  Zoom_XY(0, 1.2, 0, out xx2, out yy2);
  e.Graphics.DrawLine(p, xx1, yy1, xx2, yy2);
  e.Graphics.DrawString("Y", font, b, xx2 + 3, yy2);

  // axis Z
  Zoom_XY(0, 0, 0, out xx1, out yy1);
  Zoom_XY(0, 0, 1.2, out xx2, out yy2);
  e.Graphics.DrawLine(p, xx1, yy1, xx2, yy2);
  e.Graphics.DrawString("Z", font, b, xx2 + 3, yy2 - 3);

  // drawing the surface
  p.Color = Color.Red;
  p.Width = 1;

  for (j = 0; j <= 9; j++)
    for (i = 0; i <= 9; i++)
    {
      Zoom_XY(h0 + h * i, h0 + h * j, func(h0 + h * i, h0 + h * j),
              out xx[0], out yy[0]);
      Zoom_XY(h0 + h * i, h + h * j, func(h0 + h * i, h + h * j),
              out xx[1], out yy[1]);
      Zoom_XY(h + h * i, h + h * j, func(h + h * i, h + h * j),
              out xx[2], out yy[2]);
      Zoom_XY(h + h * i, h0 + h * j, func(h + h * i, h0 + h * j),
              out xx[3], out yy[3]);
      e.Graphics.DrawLine(p, xx[0], yy[0], xx[1], yy[1]);
      e.Graphics.DrawLine(p, xx[1], yy[1], xx[2], yy[2]);
      e.Graphics.DrawLine(p, xx[2], yy[2], xx[3], yy[3]);
      e.Graphics.DrawLine(p, xx[3], yy[3], xx[0], yy[0]);
    }
}
Let’s explain some code snippets in method Show_Graphic().
The domain of the function z = f (x, y) is divided into rectangles, in any of which the function is extrapolated by the edges of the quadrangle. Construction of quadrangles on the screen is implemented by a method DrawLine().
After clearing of canvas, occurs the drawing of axes, also fragments of the surface are displayed by DrawLine() method.
When the surface is drawn, from the method Show_Graphic() is called Zoom_XY() method that performs conversion and scaling of the actual coordinates to screen coordinates.
⇑
6. Programming the event Paint of form Form2
To get the object Graphic, you need to program the event Paint of form Form2. An example of event programming in MS Visual Studio – C# is described here in details.
The event handler Form2_Paint() gets two parameters. First of them is System.Object type, second parameter is of PaintEventArgs type.
Parameter of type PaintEventArgs includes the object Graphics, that is needed to drawing on the plane of form.
An event Paint occurs, if window is “dirty”. It does when it’s size is changed, if it ceases partially or completely close other window, if it was minimized and then maximized. In these cases it is need to redraw the form, and .NET will call the event Paint automatically.
The code listing of event handler Form2_Paint() is following.
private void Form2_Paint(object sender, PaintEventArgs e)
{
  Show_Graphic(e);
}
⇑
7. Programming of events of clicking on the buttons button1, button2, button3, button4.
The rotation of graph occurs at the moment, when user clicks on one of the buttons, placed on the form Form2 (controls button1, button2, button3, button4).
Display graphics depends on the internal variables alpha and beta. Variable “alfa” contains the rotation angle relative to the axis OZ. Variable “beta” contains the rotation angle relative to the axis OX.
Therefore, in the event handlers the values “alfa” and “beta” are changed to some value. Optionally, you can set your own value of changing of alpha and beta.
Listing of event handlers is following.
private void button1_Click(object sender, EventArgs e)
{
  beta = beta + 0.1;
  Invalidate();
}

private void button2_Click(object sender, EventArgs e)
{
  beta = beta - 0.1;
  Invalidate();
}

private void button3_Click(object sender, EventArgs e)
{
  alfa = alfa + 0.1;
  Invalidate();
}

private void button4_Click(object sender, EventArgs e)
{
  alfa = alfa - 0.1;
  Invalidate();
}
In the above event handlers, the event “Paint” is generated explicitly with the inherited method Invalidate(). This method redraws all client area by a program way.
Method Invalidate() has some overloaded variants. For example, if you need to repaint the given rectangle, then you need to create the following code:
Rectangle r = new Rectangle(0, 0, 50, 50);
Invalidate(r);
⇑
8. Programming the event handlers MouseDown, MouseMove and MouseUp.
To realize the rotation of graph using mouse, you need to program the following event handlers.
If you are press the mouse button and then hold down it over the “Form2” form and let go it, then such events are generated (Figure 4):
- MouseDown – is generated, when user clicks on the component Image1;
- MouseMove – is generated, when user moves the mouse over the component Image1;
- MouseUp – is generated if the user releases the mouse button after clicking.

Figure 4. Events MouseDown, MouseMove, MouseUp
private void Form2_MouseDown(object sender, MouseEventArgs e)
{
  f_show = true;
}

private void Form2_MouseUp(object sender, MouseEventArgs e)
{
  f_show = false;
}

private void Form2_MouseMove(object sender, MouseEventArgs e)
{
  double a, b;
  if (f_show)
  {
    a = e.X - (int)(width / 2);
    b = e.Y - (int)(height / 2);
    if (a != 0)
      alfa = Math.Atan(b / a);
    else
      alfa = Math.PI/2;
    beta = Math.Sqrt(Math.Pow(a / 10, 2) + Math.Pow(b / 10, 2));
    Invalidate();
  }
}
⇑
9. Listing of module “Form2.cs”.
Below is the full text of “Form2.cs” file that corresponds to the form Form2.
using System;
using System.Collections.Generic;
using System.ComponentModel;
using System.Data;
using System.Drawing;
using System.Linq;
using System.Text;
using System.Windows.Forms;

namespace WindowsFormsApplication1
{
  public partial class Form2 : Form
  {
    private int xx1, xx2, yy1, yy2;
    private int[] xx = new int[4];
    private int[] yy = new int[4];

    public int left;
    public int top;
    public int width;
    public int height;

    public double X_min, Y_min, X_max, Y_max;
    public double alfa, beta;
    public double x0, y0, z0;
    public double A;
    public bool f_show;

    public Form2()
    {
      InitializeComponent();
    }

    private void Zoom_XY(double x, double y, double z, out int xx, out int yy)
    {
      double xn, yn, zn;
      double tx, ty, tz;

      tx = (x - x0) * Math.Cos(alfa) - (y - y0) * Math.Sin(alfa);
      ty = ((x - x0) * Math.Sin(alfa) + (y - y0) * Math.Cos(alfa)) * Math.Cos(beta) -
            (z - z0) * Math.Sin(beta);
      tz = ((x - x0) * Math.Sin(alfa) + (y - y0) * Math.Cos(alfa)) * Math.Sin(beta) +
            (z - z0) * Math.Cos(beta);
      xn = tx / (tz / A + 1);
      yn = ty / (ty / A + 1);
      xx = (int)(width * (xn - X_min) / (X_max - X_min));
      yy = (int)(height * (yn - Y_max) / (Y_min - Y_max));
    }

    private double func(double x, double y)
    {
      double res;
      res = Math.Sin(x) + Math.Cos(y);
      return res;
    }

    private void Show_Graphic(PaintEventArgs e)
    {
      const double h = 0.1;
      const double h0 = 0;
      int i, j;

      Rectangle r1 = new Rectangle(left, top, left+width, top+height);
      Pen p = new Pen(Color.Black);
  e.Graphics.DrawRectangle(p, r1);

      // create a font
      Font font = new Font("Courier New", 12, FontStyle.Bold);
      SolidBrush b = new SolidBrush(Color.Blue);

      // draw the axises
      // axis X
      Zoom_XY(0, 0, 0, out xx1, out yy1);
      Zoom_XY(1.2, 0, 0, out xx2, out yy2);
      e.Graphics.DrawLine(p, xx1, yy1, xx2, yy2);
      e.Graphics.DrawString("X", font, b, xx2 + 3, yy2);

      // axis Y
      Zoom_XY(0, 0, 0, out xx1, out yy1);
      Zoom_XY(0, 1.2, 0, out xx2, out yy2);
      e.Graphics.DrawLine(p, xx1, yy1, xx2, yy2);
      e.Graphics.DrawString("Y", font, b, xx2 + 3, yy2);

      // axis Z
      Zoom_XY(0, 0, 0, out xx1, out yy1);
      Zoom_XY(0, 0, 1.2, out xx2, out yy2);
      e.Graphics.DrawLine(p, xx1, yy1, xx2, yy2);
      e.Graphics.DrawString("Z", font, b, xx2 + 3, yy2 - 3);

      // draw the plane
      p.Color = Color.Red;
      p.Width = 1;

      for (j = 0; j <= 9; j++)
        for (i = 0; i <= 9; i++)
        {
          Zoom_XY(h0 + h * i, h0 + h * j, func(h0 + h * i, h0 + h * j),
                  out xx[0], out yy[0]);
          Zoom_XY(h0 + h * i, h + h * j, func(h0 + h * i, h + h * j),
                  out xx[1], out yy[1]);
          Zoom_XY(h + h * i, h + h * j, func(h + h * i, h + h * j),
                  out xx[2], out yy[2]);
          Zoom_XY(h + h * i, h0 + h * j, func(h + h * i, h0 + h * j),
                  out xx[3], out yy[3]);
          e.Graphics.DrawLine(p, xx[0], yy[0], xx[1], yy[1]);
          e.Graphics.DrawLine(p, xx[1], yy[1], xx[2], yy[2]);
          e.Graphics.DrawLine(p, xx[2], yy[2], xx[3], yy[3]);
          e.Graphics.DrawLine(p, xx[3], yy[3], xx[0], yy[0]);
        }
    }

    private void Form2_Paint(object sender, PaintEventArgs e)
    {
      Show_Graphic(e);
    }

    private void button1_Click(object sender, EventArgs e)
    {
      beta = beta + 0.1;
      Invalidate();
    }

    private void button2_Click(object sender, EventArgs e)
    {
      beta = beta - 0.1;
      Invalidate();
    }

    private void button3_Click(object sender, EventArgs e)
    {
      alfa = alfa + 0.1;
      Invalidate();
    }

    private void button4_Click(object sender, EventArgs e)
    {
      alfa = alfa - 0.1;
      Invalidate();
    }

    private void Form2_MouseDown(object sender, MouseEventArgs e)
    {
      f_show = true;
    }

    private void Form2_MouseUp(object sender, MouseEventArgs e)
    {
      f_show = false;
    }

    private void Form2_MouseMove(object sender, MouseEventArgs e)
    {
      double a, b;

      if (f_show)
      {
        a = e.X - (int)(width / 2);
        b = e.Y - (int)(height / 2);
        if (a != 0)
          alfa = Math.Atan(b / a);
        else
          alfa = Math.PI/2;
        beta = Math.Sqrt(Math.Pow(a / 10, 2) + Math.Pow(b / 10, 2));
        Invalidate();
      }
    }
  }
}
⇑
10. The event programming of clicking on the button button1 of form Form1.
When you click on the button1 from form “Form1” the graph of function can be displayed.
The event handler of clicking on the button button1 is following:
private void button1_Click(object sender, EventArgs e)
{
  Form2 form2 = new Form2();

  // Rectangle, where graph of function will displayed
  form2.left = 20;
  form2.top = 20;
  form2.width = 300;
  form2.height = 300;
  form2.f_show = false;
  form2.x0 = 0;
  form2.y0 = 0;
  form2.z0 = 0;
  form2.A = -8;
  form2.alfa = 10;
  form2.beta = 12;
  form2.X_min = -3;
  form2.X_max = 3;
  form2.Y_min = -3;
  form2.Y_max = 3;
  form2.ShowDialog();
}
⇑
11. Run the application.
When you run the application the form of graph of function is shown at the Figure 5.
 Figure 5. The result of running the application
⇑